The GoldenViz Library
Why this library exists
In this chapter, I introduce the GoldenViz library as the practical companion to this book.
The book gives you the conceptual foundations. The library is where those ideas can become concrete tools, reusable checks, and actual workflows.
You can access the library documentation here: GoldenViz documentation.
Installing the library
GoldenViz is available as a Python package. I recommend installing it with pip inside a project-specific virtual environment.
Install from PyPI
pip install GoldenVizAfter installation, import the library with the same capitalization:
import GoldenViz as gvCheck your installation
You can run this small example to confirm that GoldenViz can inspect a Matplotlib figure:
import matplotlib.pyplot as plt
import GoldenViz as gv

fig, ax = plt.subplots()
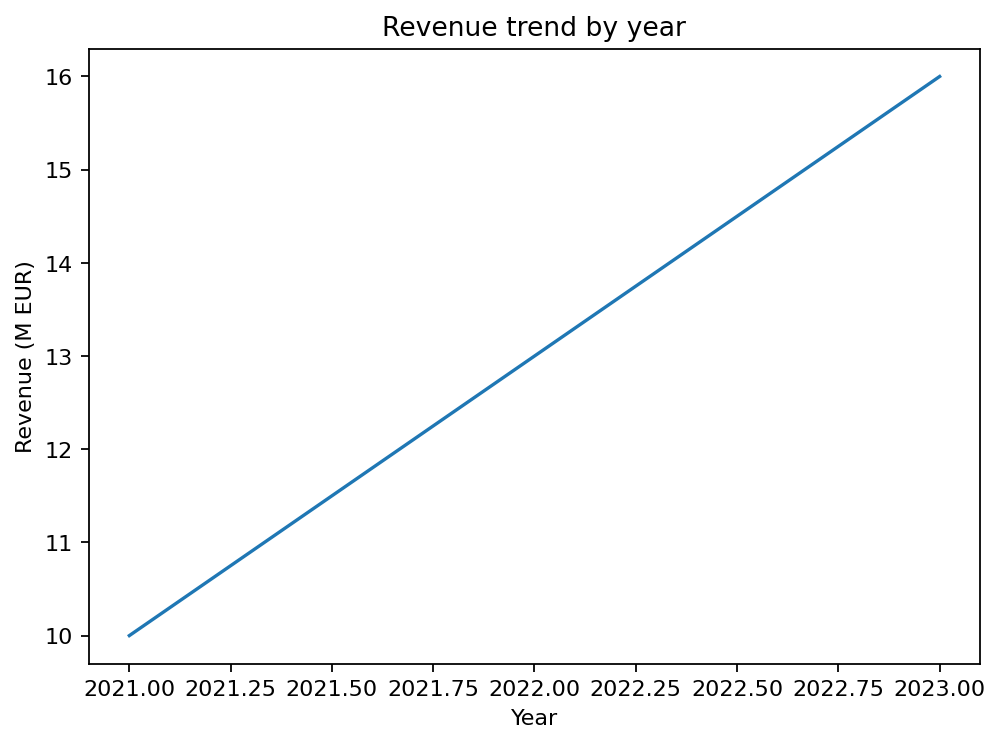
ax.plot([2021, 2022, 2023], [10, 13, 16])
ax.set_title("Revenue trend by year")
ax.set_xlabel("Year")
ax.set_ylabel("Revenue (M EUR)")

gv.check(fig)
If your installation is working correctly, you should see a simple chart like this:
You should also get an HTML report similar to the example below:
You can also open it in a separate tab here: sample GoldenViz HTML report.
Notebook users
GoldenViz works well in Jupyter notebooks and VS Code notebooks. For the best notebook experience, make sure ipykernel is installed in the same environment:
pip install ipykernelThen enable automatic chart checks inside a notebook:
import GoldenViz as gv

gv.auto()